Our website is currently facing issues loading icons; we apologise for this inconvenience and are working fast to get this fixed.
You can still apply for courses here, contact us or visit pages for information.

Excel intermediate practice workbook on a laptop screen

5 Intermediate Excel Skills for Office & Admin Jobs

If you can already sort and filter, total a column, calculate percentages and build a simple chart, you’re ready for the next level. Intermediate Excel skills help you work faster, reduce mistakes, and turn busy spreadsheets into clear updates for managers and teams.

This guide covers five practical skills that show up in office and admin roles across the UK, including common tasks used in interview tests and day-to-day reporting. It’s designed as a follow-on from our beginner guide.

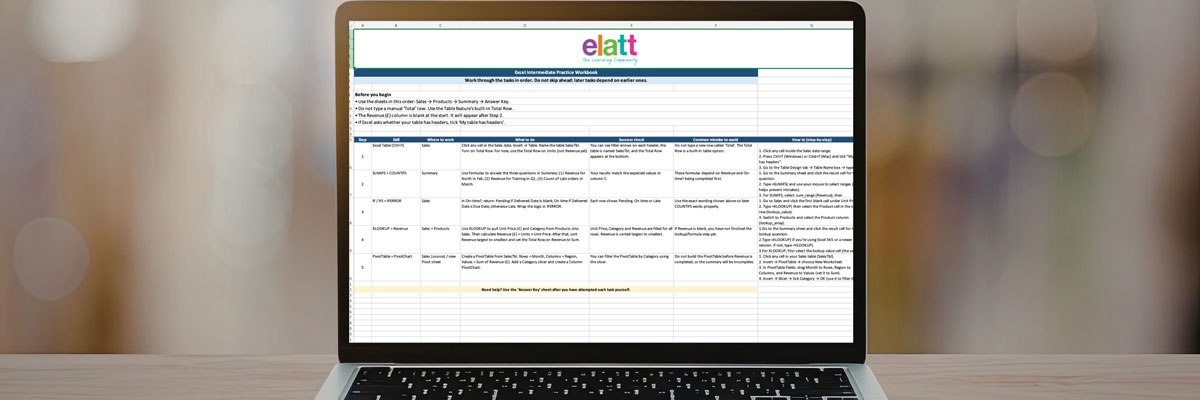
You’ll practise Excel Tables, XLOOKUP, IF/IFS with IFERROR, SUMIFS/COUNTIFS, and PivotTables.

The practice file includes a realistic dataset, prompts, and an answer key.

Why intermediate Excel skills matter for office & admin roles

Excel is still a core tool for tracking lists, dates, budgets, and simple KPIs, and many employers assess Excel confidence during hiring. Intermediate skills are what move you from “can use Excel” to “can run reporting and keep things accurate”.

How to use this guide

  1. Read each skill: What / Why / How you’ll use it / Try it.
  2. Open the practice workbook, complete the task, then repeat it from memory.
  3. Use the Answer Key to self-check and improve.

5 Excel tasks employers expect (intermediate level)

1) Excel Tables (Ctrl+T)

  • What: Turn a range into a structured table with reliable headers, filters, and totals.
  • Why this matters: Tables reduce errors when your list grows (new rows are included automatically). They also make formulas easier to read and maintain.
  • How you’ll use it at work: Tracking logs, registers, contact lists, orders, stock, and weekly reporting sheets that keep expanding.
  • Try it (practice file): On Sales, convert the range to a Table, name it SalesTbl, turn on Total Row, and sort by Units (largest to smallest).

Tip: You’ll sort by Revenue later, after you create the Revenue column.

2) XLOOKUP (or VLOOKUP) to pull the right info

  • What: Lookups match one value (like a product name or ID) and return a related value (like price, department, category).
  • Why this matters: Lookups reduce manual copying and keep data consistent, especially when lists are long.
  • How you’ll use it at work:
    • Pull prices into orders.
    • Match staff to departments.
    • Bring client details into logs.
    • Validate data entry against a master list.
  • Try it (practice file):
    1. Use XLOOKUP to pull Unit Price (and Category, if needed) from the Products sheet into SalesTbl.
    2. Create Revenue (£) = Units × Unit Price. Then sort Revenue largest to smallest and set the Total Row to Sum for Revenue.

Tip: XLOOKUP is usually more flexible than VLOOKUP, but some workplaces still use VLOOKUP.

3) IF / IFS + IFERROR (status logic)

  • What: IF (or IFS) lets you apply logic (“if this, then that”). IFERROR prevents ugly errors from breaking your sheet.
  • Why this matters: Office spreadsheets often need clear status labels (On time / Late / Pending) that update automatically.
  • How you’ll use it at work:
    • Flag overdue items.
    • Label missing information as “Pending”.
    • Create simple rules used in dashboards and reports.
  • Try it (practice file): On Sales, create an On-time? column:
    • If Delivered Date is blank → Pending.
    • If Delivered Date ≤ Due Date → On time.
    • Otherwise → Late.
    • Wrap it with IFERROR so the sheet stays clean.

4) SUMIFS + COUNTIFS (multi-criteria totals)

  • What: SUMIFS totals values based on multiple conditions; COUNTIFS counts rows that match multiple conditions.
  • Why this matters: This is the fastest way to answer “How much?” and “How many?” questions without manually filtering and risking mistakes.
  • How you’ll use it at work:
    • Total spend by department and month.
    • Count late items by team member.
    • Report monthly totals by region or category.
  • Try it (practice file): On Summary, use:
    • SUMIFS to total Revenue for Region = North and Month = Feb.
    • SUMIFS to total Revenue for Category = Training and Quarter = Q1.
    • COUNTIFS to count how many orders are Late in March.

5) PivotTables (and a PivotChart)

  • What: PivotTables summarise large lists in seconds (totals by month, department, category, region).
  • Why this matters: This is one of the most recognised “intermediate Excel” skills because it quickly turns raw data into reporting views.
  • How you’ll use it at work:
    • Monthly totals for reporting.
    • Breakdown by department/team.
    • Quick performance snapshots for meetings.
    • PivotCharts for simple visuals.
  • Try it (practice file): Create a PivotTable showing:
    • Rows: Month
    • Columns: Region
    • Values: Sum of Revenue
    • Add a Category slicer, then insert a PivotChart (Column).

Bonus: Excel interview test

Try this without notes:

  1. Convert your dataset into an Excel Table and add a Total Row.
  2. Use XLOOKUP to pull price/category and calculate Revenue.
  3. Use IF/IFS to label items On time / Late / Pending. 
  4. Use SUMIFS/COUNTIFS to answer three quick reporting questions.
  5. Build a PivotTable and a simple PivotChart (plus a slicer).

If you can do this calmly, you’re well-positioned for many admin, office coordinator, operations support, and junior reporting tasks.

Next steps: courses & support at ELATT

Want to build confidence with Excel and workplace IT skills? ELATT’s courses are career-focused and supportive, with guidance to help you move forward. You can also access careers and employability support for CVs, applications and interview preparation.

Download the workbook and complete the Bonus: Excel interview test section to check your level.

Latest Posts